Option Strategy
Long Call Option Strategy
When you long an option, it simply means that you buy it with the expectation that it will rise in value. A long call gives you the right but not the obligation to buy a security at a particular price. Call options are often used as an alternative to buying the stock directly. Since there is no limit as to how high the stock price can be at expiration date, the profit potential is “unlimited”. Also, in options trading, you avoid all of the risk that would result from direct ownership of a security.
Note: Buying too many options increases the risk as, call options have a limited lifespan. If the stock price does not move above the strike price before the option expiry, the option will expire worthless. When options expire worthless, you will lose your entire investment. On the other hand if you own a security, it will still be worth something.
- When to Use:Investor is very Bullish on a stock / index.
- Risk: Limited to the Premium. (Maximum loss if market expires at or below the option strike price).
- Reward: Unlimited
- Breakeven: Strike Price + Premium
- Profit when: The underlying security closes above the strike price.
Let’s understand with an example:

In the above figure, we have underlying price on the ‘X’ or the horizontal axis and Payoff/profit on the ‘Y’ or the vertical axis.
Here, I longed 1 lot of NIFTY.
| Current Nifty index | 120000 | |
| Call Option | Strike Price (Rs.) | 12100 |
| Paying | Premium (Rs.) | 50 |
| Paying | Break Even Point (Rs.) (Strike Price + Premium) | 12150 |
This strategy limits the downside risk to the extent of the premium I paid (Rs.50). But the potential return is unlimited in case of rise in NIFTY. A long call option is definitely the simplest way to benefit if you believe that the market will make an upward move and is the most common choice among first time option traders. As the price of the security rises, the long Call moves into profit more quickly.
Conclusion
- A long call gives you the right but not the obligation to buy a security at a particular price.
- When you long a call option, you do it with bullish expectations from the market.
- A long call strategy offers limited risk and unlimited profit. But, as you long more and more call options, the risk increases.
Long Put Option Strategy
Buying a Put option is just the opposite of buying a Call option. You buy a Call option when you are bullish about a security. When a trader is bearish, he can buy a Put option contract. A Put Option gives the holder of the Put a right, but not the obligation, to sell a security at a pre-specified price.
A long Put is a Bearish strategy. To take advantage of a falling market an traders buy Put options. If the price of the stock falls, the put option increases. This is one of the most commonly used strategy when an investor is bearish.
A long put is also used by traders in order to hedge against unfavorable moves in a long stock position. This hedging strategy is known as married put.
- When to Use:The underlying security closes above the strike price.
- Risk: Limited to the amount of Premium paid. (Maximum loss if stock / index expires at or above the option strike price).
- Reward: Unlimited
- Breakeven: Stock Price – Premium
- Profit when: The underlying security closes below the strike price.
- Loss whenThe underlying security closes above the strike price.
Let's understand with an example:
| Current Nifty index | 12100 | |
| Put Option | Strike Price (Rs.) | 12000 |
| Paying | Premium (Rs.) | 150 |
| Break Even Point (Rs.) (Strike Price - Premium) | 11750 |
This strategy limits the profits to the amount of premium I paid (Rs.150). But the risk is unlimited in case of rise in NIFTY.
Conclusion
- When you long a put option, you believe that the underlying security's price will fall.
- A long put strategy offers unlimited profit and limited risk (premium).
- Put longs are also used in order to protect the value of stocks you already own. These are called married puts.
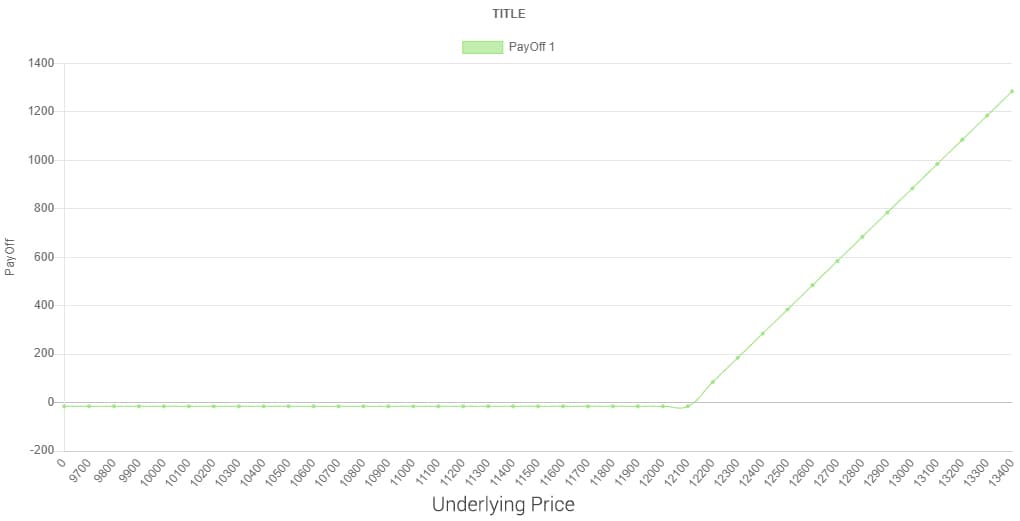
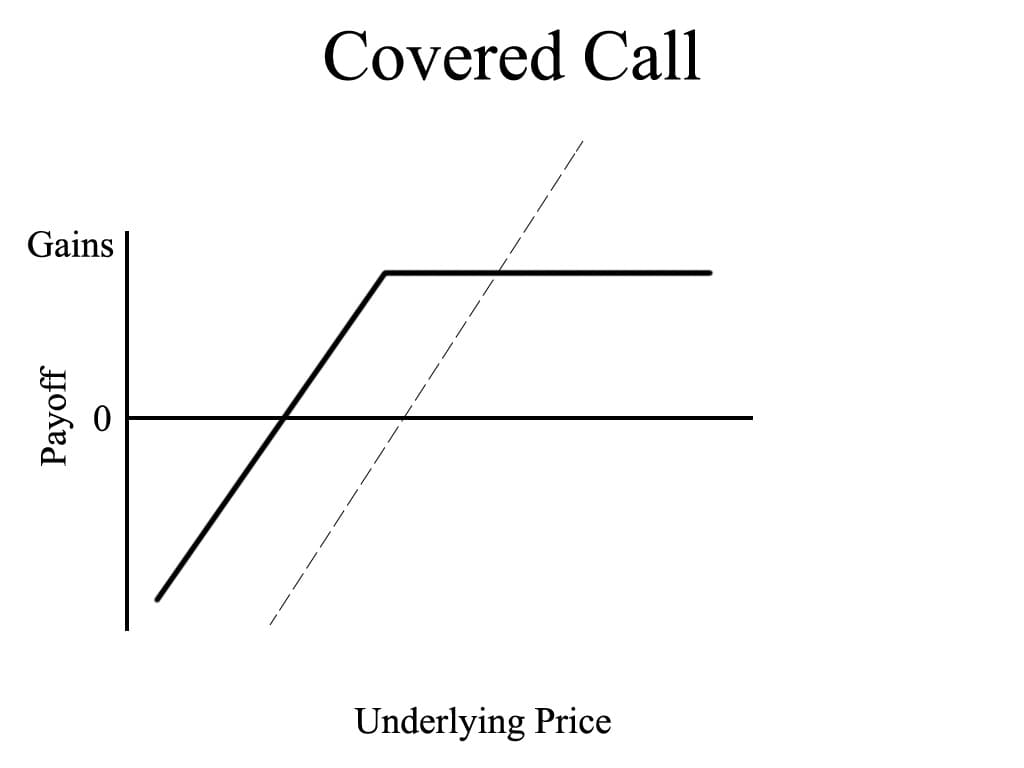
Covered Call Option Strategy
The covered call position (also called buy-write position) is created when you either buy or pre-own a stock and sell call options on that stock. If the call options are exercised the trader will sell the stock at the strike price, and if the call options are not exercised the trader will keep the stock. Usually, call options are sold out of the money. But, If you think that the stock price will go down, and you are still willing to hold your stock position, you can sell an in the money call option.
- When to Use:This is often employed when an investor has a short-term neutral to moderately bullish view on the stock he holds. He takes a short position on the Call option to generate income from the option premium. Since the stock is purchased simultaneously with writing (selling) the Call, the strategy is commonly referred to as “buy-write
- Risk: If the Stock Price falls to zero, the investor loses the entire value of the Stock but retains the premium, since the Call will not be exercised against him. So maximum risk = Stock Price Paid – Call Premium
- Risk: Limited to the Premium. (Maximum loss if market expires at or below the option strike price). Upside capped at the Strike price plus the Premium received. So if the Stock rises beyond the Strike price the investor (Call seller) gives up all the gains on the stock.
- Reward: Limited to (Call Strike Price – Stock Price paid) + Premium received
- Breakeven: Stock Price paid - Premium Received
- Profit when: The underlying security closes below the strike price.

Covered Call Payoff Chart: In the above figure, we have underlying price on the "X" or the horizontal axis and Payoff/profit on the "Y" or the vertical axis.
| Underlying stock | Market Price (Rs) | 12000 |
| Call Options | Strike Price (Rs) | 12100 |
| Received | Premium | 80 |
| Break Even Point (Rs.) (Stock Price paid - Premium Received) | 11920 |
Conclusion
- Covered call includes having a pre-owned or buying a lot of a particular security and also selling call options on that security.
- The strategy offers limited rewards and unlimited profits.
Short Call Option Strategy
When you expect the price of a stock to fall, you do the opposite of the Long Call. You can sell Call options, when you are highly bearish on a stock. It is important to clear that, this position has a limited profit potential and the possibility of large losses. It is a risky strategy since the seller of the Call is exposed to unlimited risk. It is suggested not to carry overnight positions. Also, you should always strictly comply with Stop Loss in order to regulate your losses.
To limit losses, some traders often apply a short call while owning the underlying stock. This is known as a Covered Call.
- When to Use:Investor is highly Bearish on a stock / index.
- Risk: Unlimited
- Reward: Limited to the Premium.
- Breakeven: Strike Price + Premium
- Profit when: The underlying security closes below the strike price.
- Loss when: The underlying security closes above the strike price.
Let's understand with an example:
Short Call Payoff chart: In the above figure, we have underlying price on the "X" or the horizontal axis and Payoff/profit on the "Y" or the vertical axis.
Here, I longed 1 lot of NIFTY.
| Current Nifty index | 12000 | |
| Call Option | Strike Price (Rs.) | 11900 |
| Paying | Premium (Rs.) | 50 |
| Break Even Point (Rs.) (Strike Price + Premium) | 11950 |
This strategy limits the profits to the amount of premium I paid (Rs.50). But the risk is unlimited in case of rise in NIFTY.
This strategy is used when an investor is aggressive and strongly believes that the price is going to fall. This is a risky strategy as, if the stock price rises, the short call loses money at a fast pace and the seller may suffer significant losses. Since the trader does not own the underlying stock that he is shorting, this strategy is often called Short Naked Call. Again, the maximum profit to be made from this strategy is the amount of premium paid.
Conclusion
- When you short a call option, you do it with bear expectations from the market.
- While shorting calls, you should comply with Stop Loss in order to regulate your losses.
- A short call strategy offers unlimited risk and limited profit (premium).
- Some traders, in order to limit losses, often apply a short call while owning the underlying stock. This is known as a Covered Call.
Short Put Option Strategy
Selling a Put option is opposite of buying a Put option. What you exactly sold here is the right (but not the obligation) to sell you the stock at the decided strike price.
If the price of the stock increases beyond the strike price, the short put position will make a profit for the option writer by the amount of the premium, as the buyer will not exercise the option. The amount of the premium received is the maximum profit potential. And, if the stock price decreases below the strike price, by more than the amount of the premium, the Put writer will lose money. The risk is very high.
- When to Use:Investor is bullish about the stock / index.
- Risk: Put Strike Price – Put Premium.
- Reward: Limited to the amount of Premium received.
- Breakeven: Put Strike Price – Put Premium
- Profit when: The underlying security closes above the strike price.
- Loss when: The underlying security closes below the strike price.
Let's understand with an example:
Short Put payoff chart: In the above figure, we have underlying price on the "X" or the horizontal axis and Payoff/profit on the "Y" or the vertical axis.
| Current Nifty index | 12100 | |
| Put Option | Strike Price (Rs.) | 12000 |
| Receiving | Premium (Rs.) | 150 |
| Break Even Point(Rs.) (Strike Price - Premium) | 11750 |
This strategy limits the profits to the amount of premium I received (Rs.150). But the risk is very high in case of fall in NIFTY.
Analysis: Selling Puts can be profitable in range bound markets. Still, the writer should be careful as the potential losses can be significant, if security price falls. This strategy is often considered as an income generating strategy.
Conclusion
- When you short a put option, you do so believing that the underlying security's price will rise.
- A long put strategy offers limited profit (premium) and unlimited risk.
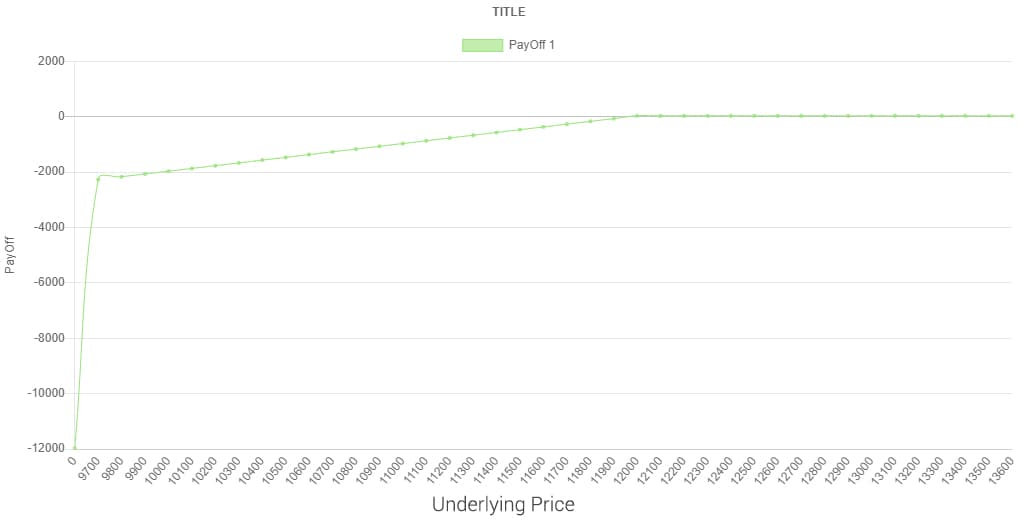
Synthetic Long Call
In this strategy, we buy a stock we feel bullish about. Now, it is a possibility that we may be wrong and the stock price may go down. So, to safeguard our investment, we buy a put option on the stock. This enables us with the right to sell the security at a certain price (i.e. the strike price). The strike price can be at the money or slightly below out of the money.
In case the stock price rises you will get the full benefit of the price rise. And if the stock price falls, you can exercise the Put Option. You have limited your loss in this manner. The Put option stops your further losses. The strategy can yield either limited loss or unlimited profit. The payoff diagram of this strategy looks like the diagram of a long call strategy and therefore it is referred to as Synthetic Call!
- When to Use:When ownership is desired of stock yet investor is concerned about near-term downside risk. The outlook is conservatively bullish.
- Risk: Losses limited to Stock price + Put Premium − Put Strike price
- Reward: Profit potential is unlimited.
- Breakeven: Put Strike Price + Put Premium + Stock Price − Put Strike Price
- Profit when: Price of Underlying > Purchase Price of Underlying + Premium Paid.
- Loss when: Price of Underlying <= Strike Price of Long Put.
Let's understand with an example:
The above image is a diagrammatic representation of the Synthetic long call. Again, on "X" axis, we have the stock price and on the "Y" axis, we have the payoff.
Here, I longed 1 lot of NIFTY.
| Buy Stock | Current Market Price of the stock (Rs.) | 12100 |
| Strike Price (Rs.) | 12000 | |
| Buy Put | Premium (Rs.) | 150 |
| Break Even Point (Rs.) (Put Strike Price + Put Premium + Stock Price − Put Strike Price) | 12250 |
Analysis: It is a strategy with limited risk. If the market falls, your losses are limited and if it rises, your profit can be unlimited.
Conclusion
- A Synthetic Long Call offers limited risk and unlimited profit.
- In this strategy you buy stocks and also a put option on those stocks.
- The strategy is labeled as Synthetic Long Call as the payoff chart for this strategy looks like a long call payoff chart.
Covered Put
Covered Put is created when a trader feels that the stock price is going to remain range bound. It is the opposite of the moderately bullish covered call strategy. In order to create a covered put, you have to short a stock and short a stock and also short put options on the stock.
The put sold is generally at the money or slightly out of the money. The investor is moderately bearish on a stock and shorts it but will buy it back once it reaches a target price (the strike price he shorted the put option at). The trader who wrote the put option, is subjected to a very high risk if there is a dramatic rise in the stock price. As the stock price has no limit, the risk here is very high.
- When to Use:If the investor is of the view that the markets are moderately bearish.
- Risk: Unlimited if the price of the stock rises substantially.
- Reward: Maximum is (Sale Price of the Stock – Strike Price) + Put Premium.
- Breakeven: Sale Price of Stock + Put Premium.
- Profit when: Premium Received - Commissions Paid.
- Loss when: Price of Underlying - Sale Price of Underlying - Premium Received + Commissions Paid.
Let's understand with an example:

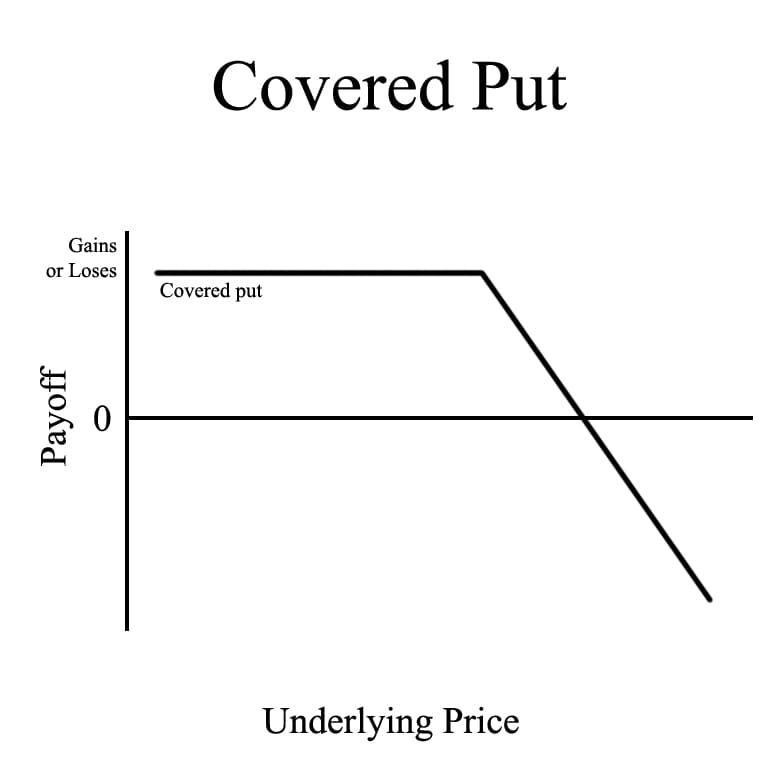
In the above figure, we have underlying price on the "X" or the horizontal axis and Payoff/profit on the "Y" or the vertical axis.
| Stock sold | Current Market Price (Rs.) | 12000 |
| Put option shorted | Strike Price (Rs.) | 11900 |
| Received | Premium | 100 |
| Break Even Point (Rs.) (Sale price of Stock + Put Premium) | 12100 |
Conclusion
- You create a covered put when you are moderately bearish on a security.
- A covered put strategy includes shorting stock and also shorting put options on that stock.
- It offers unlimited risk and limited profit.
- The break-even point for this strategy is Sale Price of Stock + Put Premium
Long Combo
You create a long combo, when you are bullish on a security. A Long Combo option strategy involves selling one out of the money Put option and buying one out of the money call option. Now , the important thing to remember here is that in case of an out of the money put option, the strike price will be lower than the current market price for the stock. And in case of an out of the money call option, the strike price will be higher than the current market price for the stock. As the stock price rises, you start making profit. This strategy is also known as Synthetic Long Stock due to the similarity in the risk/reward profile.
- When to Use:Investor is Bullish on the stock.
- Risk: Unlimited (Lower Strike + net debit)
- Reward: Unlimited
- Breakeven: Higher strike + net debit
Let's understand with an example:
In the above figure, we have underlying price on the "X" or the horizontal axis and Payoff/profit on the "Y" or the vertical axis. You should also notice that there is a gap between the strikes.
| Stock sold | Current Market Price (Rs.) | 11943 |
| Sells Put | Strike Price (Rs) | 11900 |
| Received | Premium | 100 |
| Buys Call | Strike Price (Rs.) | 12000 |
| Payed | Premium (Rs.) | 150 |
| Net Debit (Rs.) | 50 | |
| Break Even Point (Rs.) | 12050 |
Conclusion
- A trader creates a long combo when he is bullish on a stock.
- It involves shorting 1 OTM put option(lower strike) and longing 1 OTM call option(higher strike).
- Long Combo offers unlimited risk and unlimited profit.
- As it offers unlimited risk and has unlimited profit potential, it is also known as Synthetic Long Stock.
- The break even point for this strategy is Higher strike + net debit.
Long Straddle
We may form a straddle strategy when we expect the stock price to show large movements. In order to create a long straddle, we buy one ATM call option and one ATM put option on the same stock for the same maturity and strike price. Doing this, we are able to take the advantage of the market whether it goes up or comes down. If there is an increase in the stock price, the call is exercised and the put expires worthless. On the other hand, if the price of the stock decreases, the put option is exercised while the call option expires.
- When to Use:The investor thinks that the underlying stock / index will experience significant volatility in the near term.
- Risk: Limited to the initial premium paid.
- Reward: Unlimited
- Breakeven: Upper Break even Point = Strike Price of Long Call + Net Premium PaidLower Break even Point = Strike Price of Long Put − Net Premium Paid
Long Straddle Chart: In the above figure, we have underlying price on the "X" or the horizontal axis and Payoff/profit on the "Y" or the vertical axis.
| Nifty index | Current Value | 11700 |
| Call and Put | Strike Price (Rs) | 11750 |
| Payed | Total Premium (Call + Put) (Rs.) | 207 |
| Break Even Point (Rs.) | 11,957 (U) | |
| (Rs.) | 11543 (L) |
Conclusion
- A Long Straddle strategy includes longing an ATM put option and an ATM call option.
- It offers limited risk and unlimited profit.
- The upper break-even point for this strategy is Strike Price of Long Call + Net Premium Paid.
- The lower break-even point for this strategy is Strike Price of Long Put – Net Premium Paid.
Short Straddle
When we create a short straddle, we do so with a feeling that the market will not show any major movements. To create this strategy the investor sells one call option and a put option on the same stock for the same stock price and expiry. If the stock does not show any major movement in either direction, the options will not be exercised and the option writer will retain the premium as his profit. The profit here is limited to the premium received but the risk is unlimited.
- When to Use:The investor thinks that the underlying stock / index will experience very little volatility in the near term.
- Risk: Unlimited
- Reward: Limited to the premium received
- Breakeven: Upper Break even Point = Strike Price of Short Call + Net Premium ReceivedLower Break even Point = Strike Price of Short Put – Net Premium Received
Short Straddle Chart: In the above figure, we have underlying price on the "X" or the horizontal axis and Payoff/profit on the "Y" or the vertical axis.
| Nifty index | Current Value | 11700 |
| Call and Put | Strike Price (Rs) | 11750 |
| Payed | Total Premium (Call + Put) (Rs.) | 207 |
| Break Even Point(Rs.)* | 11957 | |
| (Rs.)* | 11543 |
Conclusion
- You create a Short Straddle when you feel that market is not going to show any major movements.
- A Short Straddle strategy includes shorting an ATM put option and an ATM call option. The options must have the same strike price as well as the same maturity.
- It offers unlimited risk and limited profit.
- If the stock price stays close to the strike price at the time of expiry, the investor will keep the premium as his profit. This is the maximum gain potential that can be derived by using this strategy.
- The upper break-even point for this strategy is Strike Price of Short Call + Net Premium Received.
- The lower break-even point for this strategy is Strike Price of Short Put – Net Premium Received.
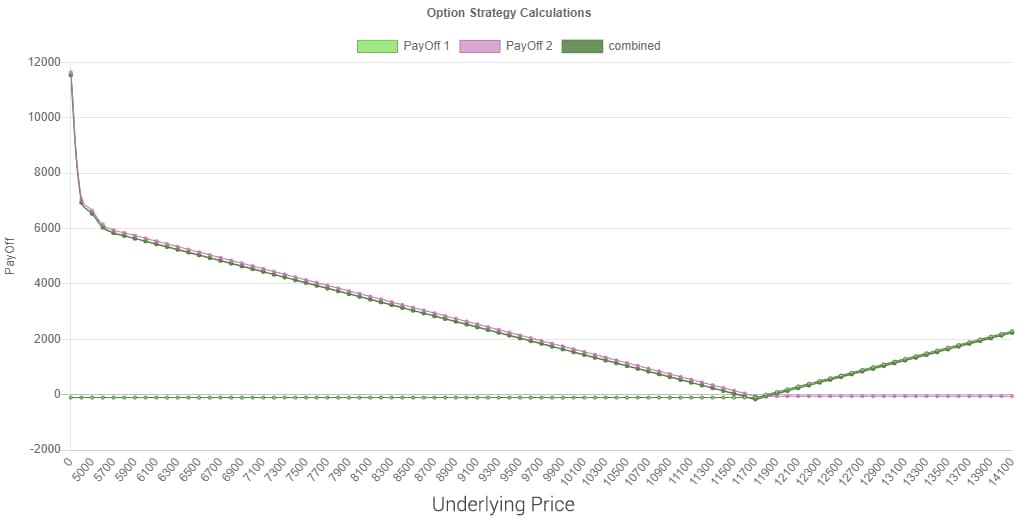
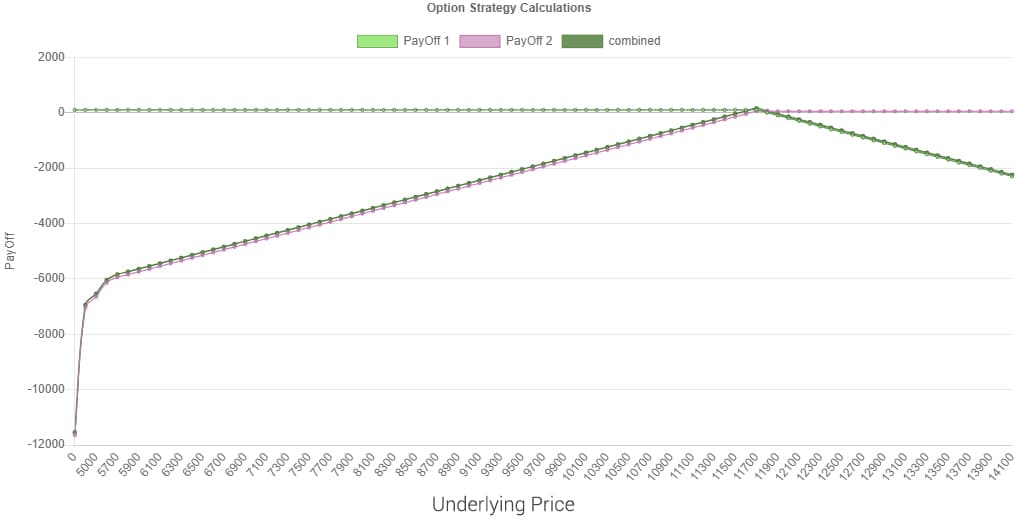
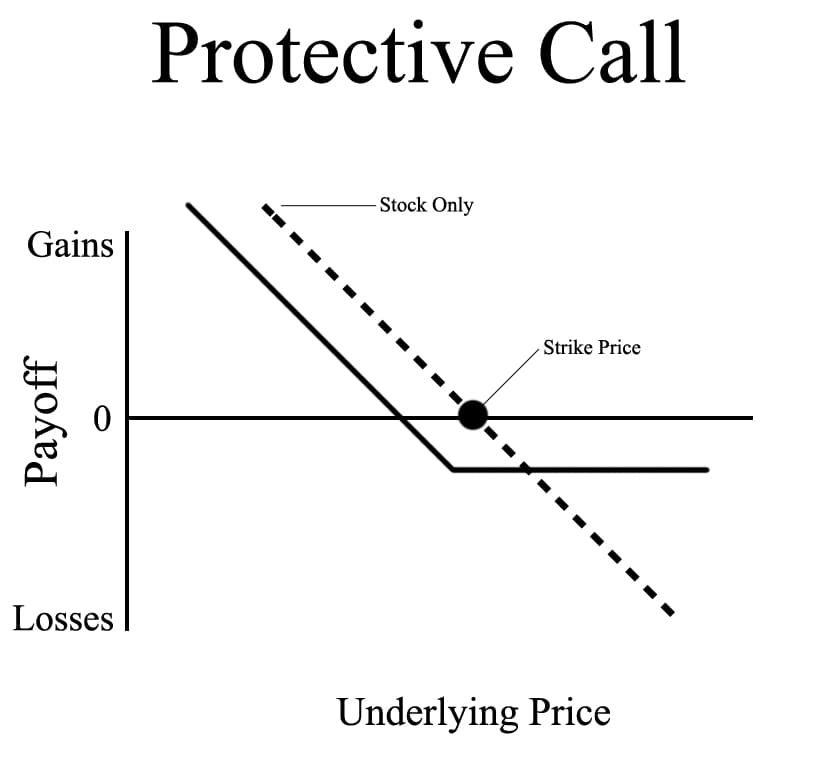
Protective Call
To create a Protective call, you begin with shorting a stock and buying a call option on that stock. You create a protective call when you are bearish on a stock. But in order to protect your decision of shorting the stock, you buy a call option. Protective call is also known as synthetic long put. This is because the payoff chart of this strategy looks like a long put payoff chart. The strategy offers limited risk and unlimited profit. This strategy is the opposite of the Synthetic Call option strategy. The call option you buy, is either at the money or slightly out of the money. When the price of the stock falls, you don't exercise the call option. And when the price is higher than the break-even point, at the time of expiry, you can exercise the option and earn the profit.
- When to Use:If the investor is of the view that the markets will go down (bearish) but wants to protect against any unexpected rise in the price of the stock.
- Risk: Limited. Maximum Risk is Call Strike Price − Stock Price + Premium
- Reward: Maximum is Stock Price − Call Premium
- Breakeven: Stock Price − Call Premium

Protective Call Option Payoff chart: In the above figure, we have underlying price on the "X" or the horizontal axis and Payoff/profit on the "Y" or the vertical axis.
| Buy Stock | Current Market Price of the stock (Rs.) | 12000 |
| Strike Price (Rs) | 12100 | |
| Buy Put | Premium (Rs.) | 150 |
| Break Even Point (Rs.) (Put Strike Price + Put Premium + Stock Price – Put Strike Price) | 11850 |
Conclusion
- This is a strategy where an investor has gone short on a stock and buys a call to hedge.
- The strategy offers limited risk and unlimited profit potential.
- This strategy is also known as Synthetic Long Put.


