Nifty Open Interest
SELECT EXPIRY DATE:
Spot:
Nifty Option Chain
Why do people find it hard to understand the concept of Nifty Option Chain?
Usually the main reason for confusion ends up being the presentation of the data. If you visit the Nifty Option Chain page on Yahoo Finance, Money Control or your brokerage account, you will notice that the layout of each of their option chains is completely different. You are here right now at Stock Ezee the Nifty option chain here will have a different presentation than the one shown on NSE website. This leads to confusion. But let's clear it up. The presentation may be different, but the data will remain the same. So don't get confused with what Nifty Option Chain presentation to go with, choose the one that suits you the best because ultimately, the data shown will be the same.

What is Nifty Option Chain?
Nifty Option Chain also known as Nifty Option Matrix, shows a listing of all available option contracts (puts as well as calls), for the NSE index Nifty 50.
Significance of Nifty Option Chain.
Nifty Option Chain enables quick scanning of activity, open interest (OI), and price changes. This enables traders to quickly find a security's trading activity, volume, interest by strike price and time to maturity.
What Nifty Option Chain shows you?
Nifty Option Chain is divided into two parts: call options and put options.
- Call options:Call is an option contract that gives you the right but not the obligation to buy the underlying asset at a predetermined price before or at the time of expiry.
- Put Option:Put is an option contract that gives you the right but not the obligation to sell the underlying asset at a predetermined price before at the time of expiry.
- Both call and put options can be either in the money or out of the money. Now, this information can be highly important in helping you decide, which option you should invest in.
In case of Put Options
- When strike price < current stock price, the option is out of the money.
- When strike price > current stock price, the option is in the money.
- And when strike = current stock price, the option is at the money.
In case of Call Options
- When strike price < current stock price, the option is out of the money.
- When strike price > current stock price, the option is in the money.
- And when strike = current stock price, the option is at the money.
Nifty Option Chain and Open Interest
Why do people find it hard to understand the concept of Nifty Option Chain?
Usually the main reason for confusion ends up being the presentation of the data. If you visit the Nifty Option Chain page on Yahoo Finance, Money Control or your brokerage account, you will notice that the layout of each of their option chains is completely different. You are here right now at Stock Ezee the Nifty option chain here will have a different presentation than the one shown on NSE website. This leads to confusion. But let's clear it up. The presentation may be different, but the data will remain the same. So don't get confused with what Nifty Option Chain presentation to go with, choose the one that suits you the best because ultimately, the data shown will be the same.
If both parties (buyer and seller) to the trade are initiating a new position, open interest will increase by one contract. If both traders are closing an existing position, the open interest is going to decline by one contract. If one old trader passes off his position to a new trader, open interest will remain the same. Increase in OI suggests that new money is flowing into the marketplace. The result will be that the present trend is likely to continue. Decrease in OI suggests that the market is liquidating, implying that the prevailing price trend is nearing to an end.
In order, to determine the total OI for any given market, we only need the OI data from one side or the other, buyers or sellers, and not the sum of both. Open interest can be a measure of market activity. Little or no open interest implies that either there are no opening positions, or nearly all the positions have been closed.
High open interest suggests that there are many contracts still open, which means market participants will be watching the market closely.
Open interest is often used as an indicator of trend strength. As rising open interest implies additional money and interest coming into a market. It is generally perceived as an indication that the existing market trend is gaining momentum or is likely to continue.
Many technical analysts are of the thought that knowledge of open interest can present useful information about the market.
Volume and Open Interest
Why do people find it hard to understand the concept of Nifty Option Chain
When combined with open interest, volume illustrates the total number of securities that have changed owners in a one-day trading session either in the commodities or in the options market.
With increase in the amount of trading during a market session, the trading volume goes higher. The higher the volume, the more we can hope the existing trend to proceed further.
Technical analysts are of the belief that volume precedes price, implying that the loss of either the upside price pressure in an uptrend or the downside pressure in a downtrend will be revealed in the volume figures before presenting itself as a trend reversal. The rules that have been set for both volume and open interest are combined because of their relationship.
Do note, if there is an abnormally high OI backed by an accelerated increase or decrease in prices then be careful. This situation simply means that there is a lot of euphoria and leverage is being built up in the market. In situations like these, even a small incident could trigger a lot of panic and disturbance in the market.

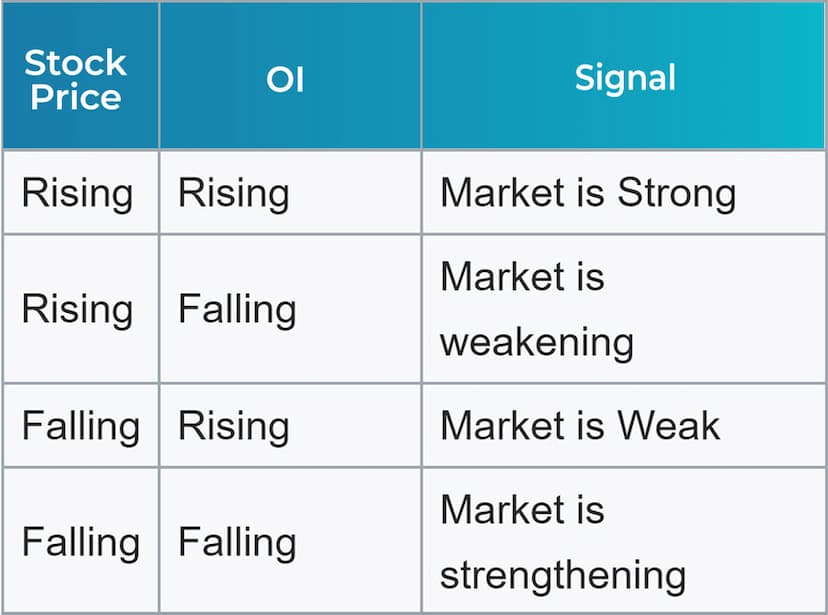
How to interpret Change in Open Interest?
- If the price increases and the OI increases, then there is strength behind it.
- If the price decreases and the OI increases, then there is strength behind it.
- If the price increases and the OI decreases, then there is weakness behind it.
- If the price decreases and the OI decreases, then there is weakness behind it.
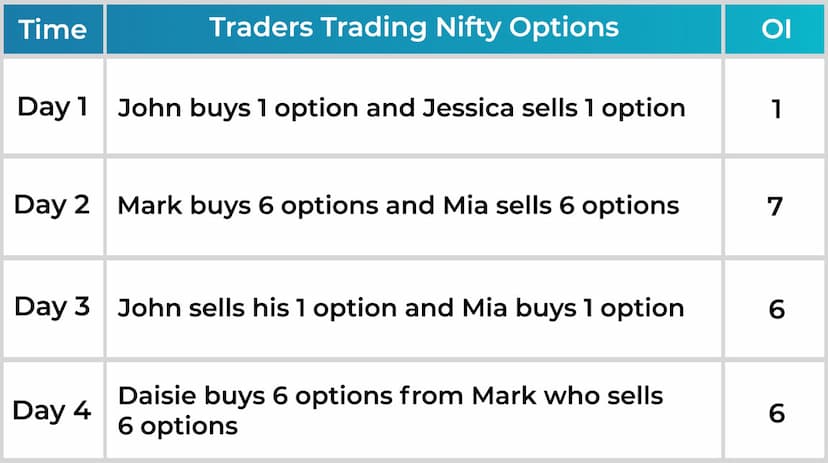
Understanding with an example. Below is a table of trading activity in the options market for traders, John, Jessica, Mark, Mia, and Daisie.
Let's create an OI schedule.
- Day 1:OI increases by 1 as only one contract is created consisting of a buy and a sell
- Day 2:6 new options contracts are created, so OI increases to 7.
- Day 3:OI declines by 1 because John and Mia sell 1 contract to close their positions. As stated earlier, open interest is not the total of buy and sell trades.
- Day 4:OI remains at 6 as there are no new contracts created. Daisie bought 6 existing contracts from Mark.
I hope the above schedule helped you understand how OI works. You might have heard the phrase that FnO is a zero-sum game, well now you know why it is termed like that. The OI just indicates the amount of open positions that are there in the market. If we allot a plus or a positive (+) sign to a long (buy) position and minus or a negative (−) sign to a short (sell) position and add up the long and short positions, the sum will always be equal to zero. For every option buyer, there must be an option seller.
Conclusion
- Nifty Option Chain shows a listing of all available option contracts, for the NSE index Nifty 50.
- The presentation of the Nifty Option Chain may be different, but the data will remain the same.
- OI is the total number of outstanding derivative contracts that have not been settled.
- OI is equal to the total number of bought or sold contracts, not the total of both added together.
- OI is a must use tool for traders, trading in the futures and options markets.
- FnO is a zero sum game. If we allot a plus or a positive (+) sign to a long (buy) position and minus or a negative (−) sign to a short (sell) position and add up the long and short positions, the sum will always be equal to zero
- An increase in OI implies additional money coming into the market. And decrease in OI suggests money flowing out of the market.
- OI and volume are not the same. Unlike volumes, OI is continuous data. Volume is used to denote the number of contracts that change hands in a day, whereas OI only calculates open positions in the market.


